An analyst for your infrastructure, running inside your network.
We deploy a container in your cluster or network, and build the tools it uses around the systems you actually run: firewalls, proxies, monitoring, logs, delivery pipelines. With all of them in reach, it troubleshoots across every layer at once and answers the question every incident starts with: what changed, and where? It works with any language model behind an OpenAI-compatible API, including one you host yourself, so your telemetry can stay inside your network.
An engineer on call checks the dashboards, the proxy stats and the deployment log one at a time. The agent reads them together and shows its working.
Why did checkout get slow at 14:10?
envoy · prometheus · ci
p99 latency from checkout to payments rose from 180 ms to 1.4 s at 14:08. Envoy shows retries to payments up sixfold, with upstream timeouts. payments was deployed at 14:06; that release changed the database connection pool settings.
Which deployment last week caused the error-rate step?
prometheus · ci
5xx responses on the orders API stepped from 0.2% to 1.1% on Tuesday at 10:42. Three pipelines deployed within 30 minutes of that; only orders-api touches that route. The step has not recovered since.
What is likely to hit a limit this month?
prometheus · forecast
Disk on the primary database is forecast to pass 90% in about 11 days at the current trend. The forecast range is wide: there are only five weeks of history for that volume, so treat it as an early warning.
BUILT AROUND YOUR INFRASTRUCTURE
Tools written for your stack, not a fixed list of integrations.
For each client we write the tools the agent uses, and the troubleshooting logic that decides which to reach for and in what order. Every tool uses read-only credentials you issue and can revoke. The examples below are a starting point, not a limit.
LAYER
EXAMPLES OF WHAT THE AGENT CAN READ
Network and firewalls
Cilium network policies and flow logs, FortiGate and other firewalls: which connections were allowed or dropped, and by which rule.
Proxies and service mesh
Envoy and similar proxies: latency, response codes, retries, timeouts and upstream health between your services, per route.
Monitoring and alerting
Prometheus and Grafana (through MCP), Nagios and similar systems: metrics, check states and alerts. The agent writes its own queries, so it can look beyond what your dashboards already show.
Clusters and hosts
Kubernetes events, restarts, resource limits and node pressure; host health and service status.
Delivery
Commits, merges, pipeline runs and deployments from your CI/CD system, through a read-only token, lined up against the moment something changed.
Forecasting
Google’s TimesFM time-series model, run on your metric history, to flag capacity and error trends heading for a limit. It needs several weeks of consistent history to be useful, and more for seasonal patterns. We use TimesFM 2.5 by default, which is free to use; TimesFM 3.0 is available for larger deployments under a commercial licence from Google.
Something else
If a system has an API, a CLI or logs the agent can reach, we can usually write a tool for it. We agree the list during scoping.
YOUR MODEL, YOUR NETWORK
You decide where your telemetry goes.
Model options
Your own inference server, such as vLLM, inside your network. Recommended: prompts and telemetry never leave it.
We deploy one for you on a single GPU with 80 or 96 GB of memory, in your environment.
Any OpenAI-compatible API. Your telemetry is then sent to that provider, under your own agreement with them.
How it is deployed
one container image, on Kubernetes or a Docker host
read-only credentials for every source, issued by you
no changes to the systems it reads
network access only to the sources and the model endpoint you configure
remove the container and revoke its credentials, and it is gone
THE BETA
A small number of teams, working with us directly.
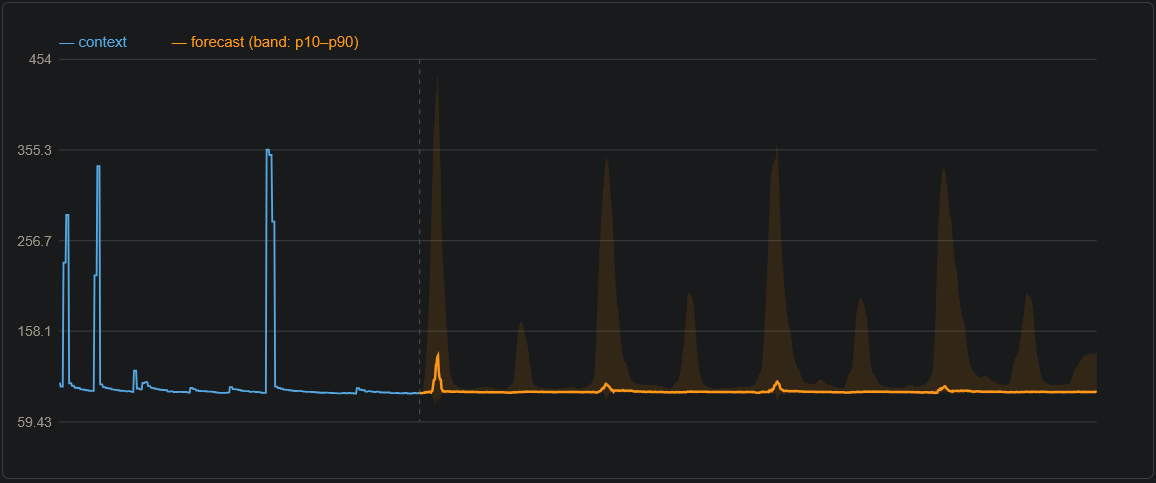
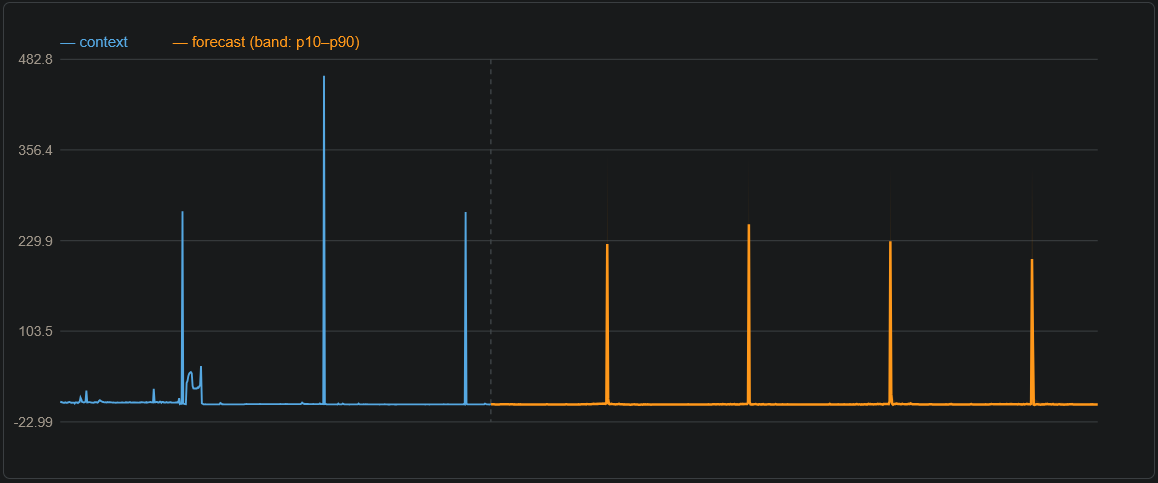
The forecasting already runs on real metrics. These two forecasts come from a single-user test lab with one GPU, one switch and only a month of metric history, made with TimesFM 3.0. A production environment, with more history and more related metrics, gives the model far more to work with. In each chart, blue is what happened, orange is what the model expects next, and the shaded band is its p10–p90 range.
Device power drawCollected with an OpenTelemetry collector: 48 hours of history at 15-second steps, forecast 4 hours ahead. The median stays near idle, while the shaded band marks where bursts like the ones in the history are likely to return.Traffic spikes on a switch portCollected from the switch over SNMP. From 785 data points of history with occasional sharp spikes, the model forecasts the next 720 points as a recurring pattern of spikes: the kind of load to plan capacity and alerts around.
01
We scope it together.
A call to go through your stack: which network, monitoring and delivery systems you run, where a model could be hosted, and the incidents you would most like explained.
02
We deploy it with you.
We write the tools for your systems, install the agent in your environment alongside your team, and check its answers against incidents you already understand.
03
You use it, and tell us.
Your team uses it day to day. We ask for regular feedback and a short call every two weeks. Beta terms, including price, are agreed with each participant.
A LITTLE MORE CLARITY
The infrastructure agent, straight answers.
Does any of our data leave our network?+
Not if the model runs inside your network. The agent sends prompts, and the telemetry it has read, only to the model endpoint you configure. If you point it at an external provider, that data goes to that provider under your agreement with them.
Do we need a GPU?+
Only if you want the model hosted inside your network and don’t already have an inference server. A single GPU with 80 or 96 GB of memory is enough for the deployment we offer. If you already run vLLM or a similar server, the agent uses that.
What do you need from us?+
A place to run one container, network access from it to the systems it should read, and a read-only account or token for each, such as a Grafana viewer account or a read-only CI/CD token. We agree the exact list during scoping.
Can it predict outages?+
It can forecast where your metrics are heading and flag trends that are approaching a limit, such as disk, connections or error rates. That depends on history: with a few weeks of consistent metrics the forecasts are rough; with months, they can pick up daily and weekly patterns. It does not replace your alerting.
Which forecasting model does it use?+
Google’s TimesFM, running inside your environment like the rest of the agent. By default we deploy TimesFM 2.5, whose weights are released under the Apache 2.0 licence, so there is no licence cost. TimesFM 3.0 is Google’s newer model, but its weights are licensed for non-commercial use only, so a production deployment needs a commercial licence from Google. We offer it for large deployments where that cost is worth it.
Can it change anything?+
No. We deploy it with read-only access to every source. It reads and explains; your engineers decide what to do.
Is this part of Auditon’s vulnerability scanning?+
No, it is a separate service from the same team. You can use either one on its own.
BETA PLACES ARE LIMITED
Find out what changed, before the post-mortem.
Tell us about your stack, and we’ll set up a scoping call.
Example conversations on this page are illustrative and use sample data. Product names on this page belong to their respective owners; Auditon is not affiliated with or endorsed by them.